Intel Arc B70 context decay: the KV cache setting that fixes it
A reader's question led to a depth-swept benchmark on the Intel Arc B70. Generation halves by 32K on stock settings — f16 KV cache on SYCL fixes it.
A month ago I published a set of Intel Arc B70 benchmarks and called Vulkan the right backend. A reader who’d followed that advice sent me a message:
tried your llama vulkan recommendation for a B70, and I get similar t/s as you reported but they decay very fast as the context grows.
I gave him the answer everyone gives, which is that yes, throughput drops as context grows, and that’s normal. He pushed back:
it does it to some degree with SYCL as well, just with vulkan the decay is so extreme, making it unusable
I didn’t have data to argue with. Every number in my last post — and every B70 number I can find published anywhere — was captured at a single shallow prompt size. None of it says anything about what happens when the prompt is 30,000 tokens instead of 2,000.
So I spent an afternoon measuring it. He was right. And the fix turned out to be a one-line change I’d explicitly recommended against.
First, the vocabulary
This post leans on four terms. If you already know them, skip ahead — but the tables further down don’t make sense without them, and most benchmark writeups blur them together.
Prefill is the model reading your prompt. Before it can write a single word of a response, it has to process everything you sent it. Send it 30,000 tokens of code and it does 30,000 tokens of work first. This is what “time to first token” measures.
Decode is the model writing its response, one token at a time. This is the number people quote as “tokens per second” and it’s what you watch stream across the screen.
The two are different kinds of work and they fail differently, which is the whole reason this post exists. “It got slower” can mean either one.
Depth is how much context is already in play — the length of the prompt being processed. A fresh question is shallow. Message forty of a coding session with three files pasted in is deep.
Cold vs warm is whether the model has seen this prefix before. Ask a follow-up question in an existing thread and llama.cpp keeps the earlier work in its cache, so it only has to process the new part. That’s a warm request. A brand-new conversation, or a fresh call from an agent that rebuilds its prompt each time, is cold and pays full prefill cost.
Standard benchmarks measure cold prefill and decode at one shallow depth. Real agent work is a mix of everything above.
What I built
I needed a curve rather than a point, so the benchmark walks a series of prompt depths — 2K, 8K, 16K, 32K — and at each one runs the same request twice: once cold, once warm. It pulls the prefill and decode timings separately out of llama-server’s API response rather than timing the whole request, so the two never get blended into one number.
Running each depth cold and then warm is the diagnostic, at least in theory. If only the cold numbers get worse as depth grows, the problem should be prefill, and prompt caching solves it. If the warm numbers get worse too, the cost is somewhere caching can’t reach.
Finding 1: generation halves, and caching does nothing about it
Here’s my production configuration — Vulkan, q4_0 KV cache, the exact setup my
last post recommended:
| Prompt depth | Cold decode | Warm decode |
|---|---|---|
| 2,048 | 73.1 t/s | 73.1 t/s |
| 8,192 | 60.9 t/s | 60.9 t/s |
| 16,384 | 50.1 t/s | 50.1 t/s |
| 32,768 | 37.1 t/s | 37.1 t/s |
Generation drops from 73 tokens per second to 37 as the context fills. Half your throughput, gone, on the same hardware running the same model.
And the warm column is identical to the cold one. Not close — identical, at every depth, across four separate sweeps. Prompt caching removes the prefill cost entirely and does nothing whatsoever for the generation rate.
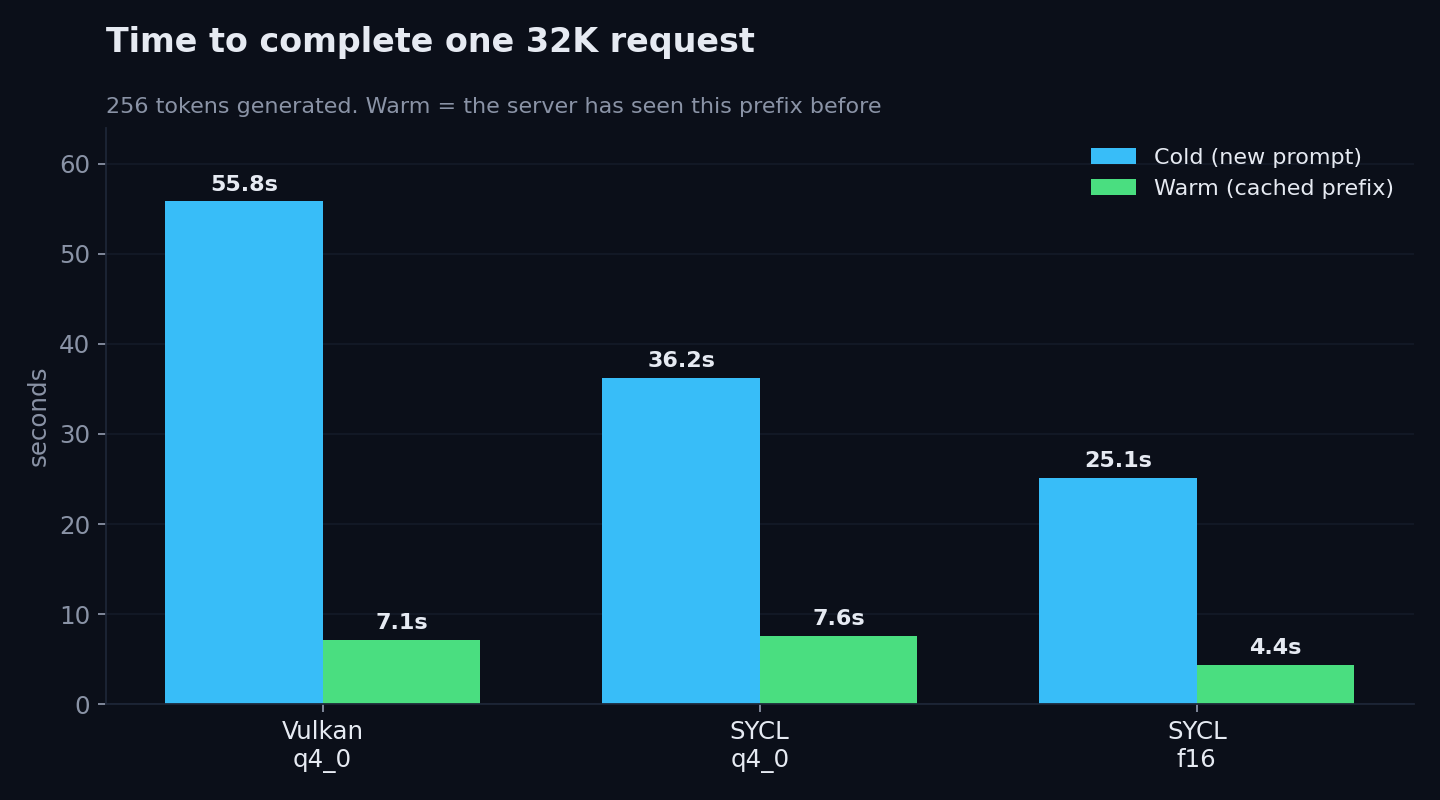
That explains something you’ve probably noticed if you use a coding agent. A long thread feels fine after the first message, because the time you spend waiting drops enormously — at 32K a cold request takes 56 seconds and the same request warm takes 7. But the tokens aren’t arriving any faster. You’ve just stopped paying for the prefill.
Finding 2: the setting I skipped testing
My last post recommended q4_0 for the KV cache. Quantizing the cache to 4 bits
saves a lot of memory, and at shallow depth it costs nothing measurable. I tested
it against q8_0, found q8_0 slower, and moved on.
I never tested f16 — the uncompressed option — because it’s four times the size
and the pattern from q4_0 versus q8_0 suggested bigger was worse. That was an
extrapolation from two points, and it was wrong.
Same card, same model, same build. Single stream, generation speed:
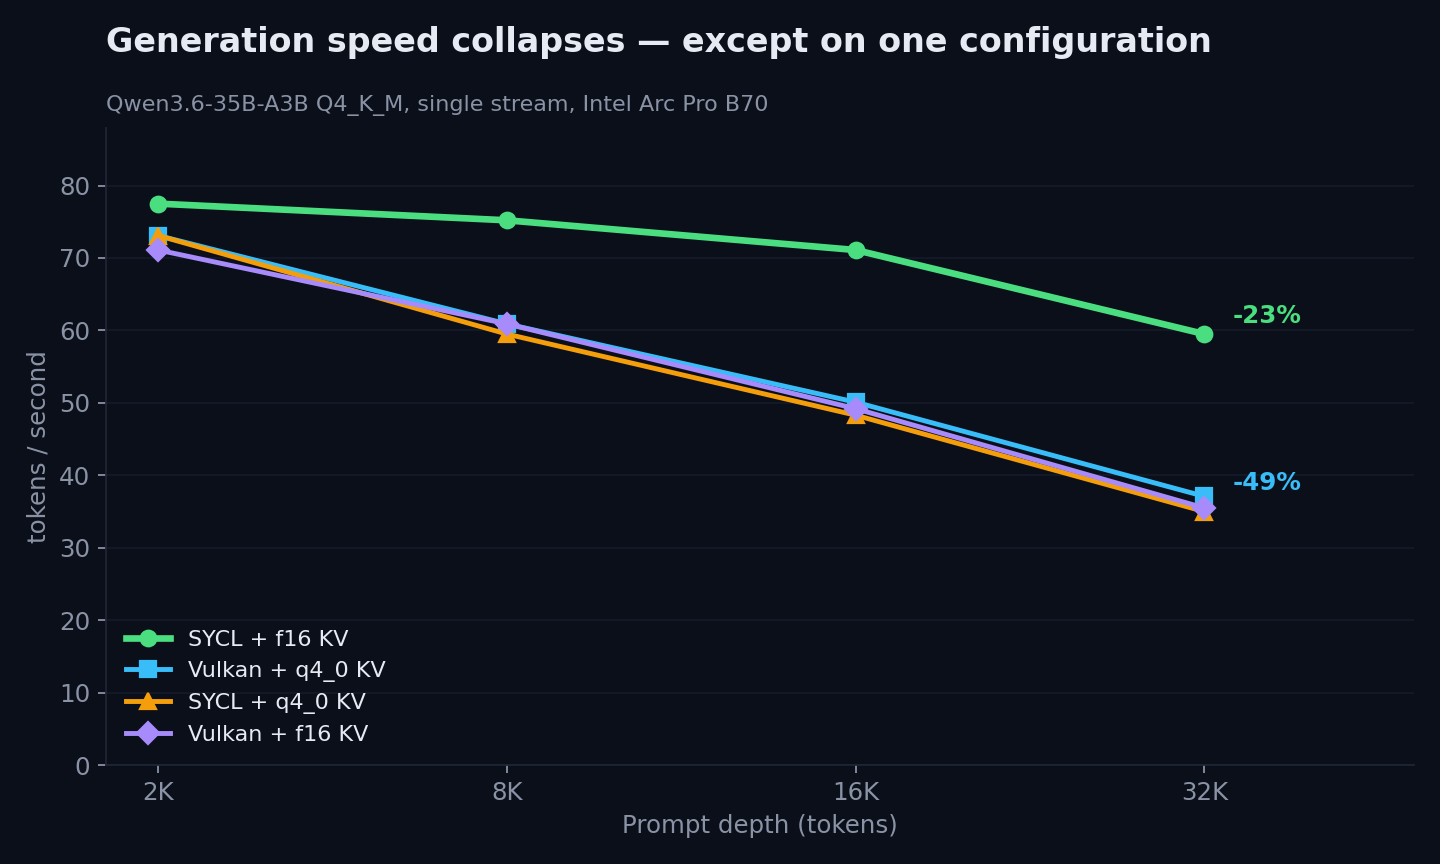
Three of those four configurations lose about half their generation speed by 32K.
One loses 23%. At 32K, SYCL with f16 is 60% faster than what I’ve been running.
Prefill tells the same story:
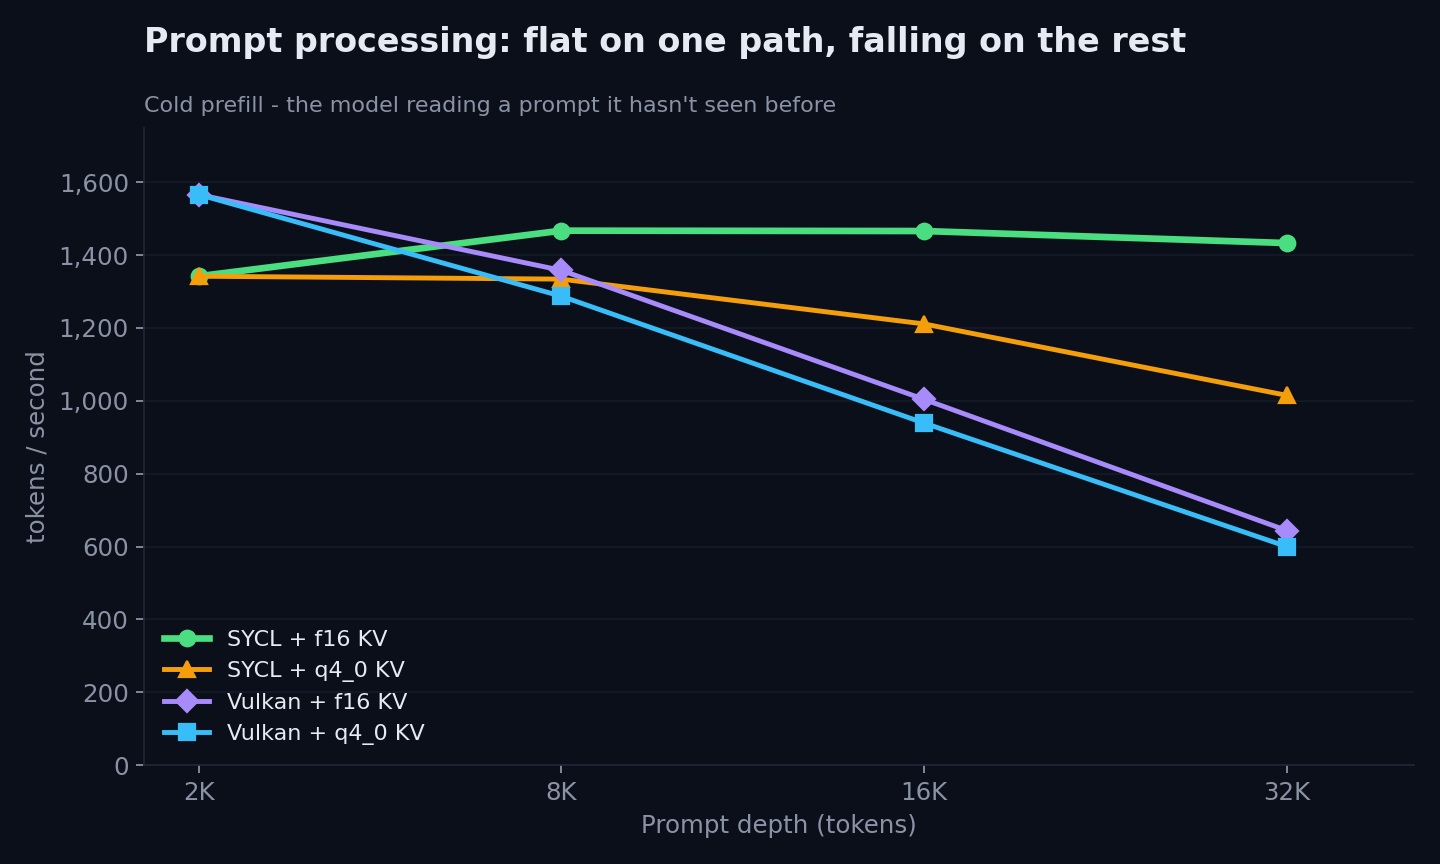
Vulkan collapses to 38% of its peak. SYCL with f16 is flat — it actually reads a
32,000-token prompt slightly faster than a 2,000-token one, because the fixed
overhead is amortized over more work.
Note the Vulkan f16 line. It decays exactly like Vulkan q4_0 does. So this
isn’t the cache format on its own — it’s specific to SYCL.
Put together, the difference in how long you actually wait is substantial:
What I think is happening, and what I ruled out
The obvious explanation was a llama.cpp merge from about a week before I
ran these tests: a new SYCL flash-attention path routed through Intel’s oneDNN
library, with f16 KV listed as one of its requirements — and benchmarked, by the
people who wrote it, on this exact card. My build is from after that merge. It
fit.
So I tested it. llama.cpp lets you disable the oneDNN path with an environment variable, and I re-ran the entire sweep with it off:
| Prompt depth | oneDNN on | oneDNN disabled |
|---|---|---|
| 2,048 | 77.5 t/s | 80.0 t/s |
| 8,192 | 75.2 t/s | 75.2 t/s |
| 32,768 | 59.5 t/s | 65.6 t/s |
No difference. But that test is weaker than it looks: the new path routes through oneDNN’s graph API, and I can’t be sure the environment variable I flipped reaches it rather than only the older matmul dispatch. A null result from a switch that might not be wired to anything isn’t evidence.
So I settled it the direct way. I still had a SYCL build from 20 June, five weeks
before that PR landed — it cannot contain the merge. Same f16 sweep, same card:
| Prompt depth | 20 June build (pre-merge) | Current build (post-merge) |
|---|---|---|
| 2,048 | 75 t/s | 77.5 t/s |
| 8,192 | 61 t/s | 75.2 t/s |
| 16,384 | 61 t/s | 71.1 t/s |
| 32,768 | 64 t/s | 59.5 t/s |
The June build loses 15% between 2K and 32K and then stops sliding. Against q4_0’s
49% that is the same qualitative behaviour I had been crediting to a patch that
wasn’t in the binary. f16 on SYCL was already resisting decode decay five weeks
before the merge existed. That’s the reader’s actual problem, and the merge didn’t
fix it because it was never broken.
The merge does show up — just not where I went looking. It’s a prefill patch, and
its authors describe the path it replaces in terms I’d have recognised: SYCL’s older
flash attention “degrades the prefill worse than fa=0”, they write,
because “prefill decays with context” instead of benefiting from flash
attention’s memory efficiency. The headline claim is a 4.26x prefill gain at 80K.
And prefill is exactly where the two builds part company. The June build’s f16 prefill sags at
depth, 1,566 down to 1,218 t/s at 32K. The current build holds flat near 1,433.
So there are two effects here with two different causes, and I had collapsed them
into one. Decode holding flat is a pre-existing property of SYCL’s f16 attention
path that nobody noticed because nobody runs f16 KV — the whole reason quantized
cache exists is to save VRAM, so that’s what everyone benchmarks, including me. The
setting that fixes context decay on this card is the one the memory math tells you
not to use. The merge sits on top of that and buys you deep prefill you didn’t have
in June.
What I still can’t tell you is why the f16 path holds up on decode. I can tell
you what I measured and what I eliminated; the kernel-level reason is a question for
someone reading the SYCL backend source.
Finding 3: it survives concurrency
Single-stream numbers are only half the picture for agent work. My production setup runs four parallel slots, so I ran the sweep again with four concurrent requests.
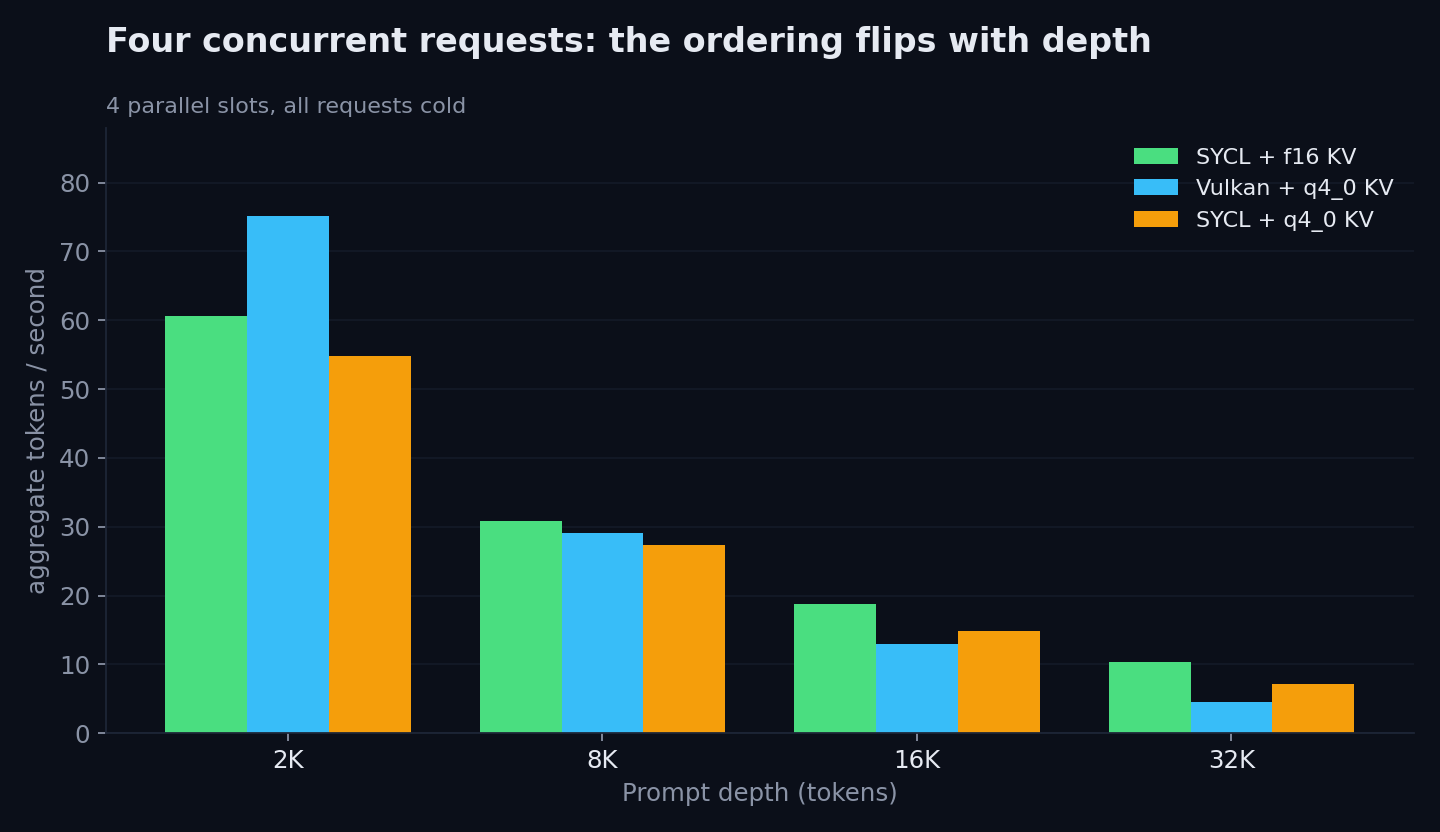
Vulkan wins at 2K. Past 8K, f16 pulls ahead, and by 32K it’s 2.3× Vulkan’s
aggregate throughput.
In wall time: four concurrent 32K requests finish in 99 seconds on SYCL f16
against 227 on Vulkan q4_0. Same work, less than half the time.
Those aggregate numbers look small because they count generated tokens against total elapsed time, and at 32K nearly all the time is prefill. The ratio between configurations is the meaningful part, not the absolute value.
The catch: VRAM
f16 KV is four times the size of q4_0, and that constrains how much context
you can hold.
On a 32 GB B70 with the 20.6 GB model loaded, f16 at 32K single-stream costs
about 1.4 GB. Scaling up: four slots at 48K each fits, which is what produced the
tables above. Four slots at 64K — my current production configuration — does not.
The memory isn’t there.
So the practical choice on this card is roughly:
- 4 slots × 48K,
f16— fast at every depth, less per-slot context - 4 slots × 64K,
q4_0— more context, half the speed past 16K - 1 slot × 128K,
f16— deep single-session work, no concurrency
There’s a real tradeoff in there. Shorter slots mean an agent hits its context limit sooner and has to compact — summarize and drop history — more often. But the compaction penalty is much cheaper on the fast config: re-reading a 32K conversation costs about 22 seconds at 1,433 t/s, against roughly 50 seconds at Vulkan’s 600 t/s. The configuration that compacts more often also recovers from it faster.
I haven’t measured how often my agents actually compact in real sessions, so I can’t tell you where that balance lands. It’s the obvious next thing to instrument.
A note on noise
Something no benchmark captures: this card makes an audible grinding, high-pitched sound under load — coil whine, varying with the workload rather than constant. On SYCL it’s bad enough that I wear noise-cancelling headphones. Before the Mesa 26.1 upgrade I wrote about last month, Vulkan sounded the same way; afterward it went quiet.
Same hardware, same room. A driver update changed how much noise it makes, which suggests it’s a function of what the kernels are doing electrically rather than a defect in the card.
If you work in the same room as this machine, that’s a real cost of the SYCL configuration and it doesn’t show up in any table.
So what should you actually run?
If you work at depth — long coding sessions, large pasted files, agents with
substantial context — switch to SYCL with f16 KV and size your slots to fit. At
16K and beyond it wins on generation, prefill, and concurrency simultaneously.
There’s no axis where it loses.
That includes cold batch work — document pipelines, agents that rebuild a large
prompt on every call, anything where a fresh 30K prompt is the normal case.
Reading a cold 32K prompt takes 25 seconds on SYCL f16 against 56 on Vulkan
q4_0.
If your prompts are short and you run high concurrency, stay on Vulkan with
q4_0. It wins at 2K single-stream and it wins at four concurrent short requests,
and it does it quietly.
If you need maximum per-slot context, q4_0 is still the only way to fit 64K
slots on 32 GB. You’re trading half your speed past 16K for it.
I’m adding SYCL f16 profiles to my launcher and running them for anything
deep. Whether they become the default depends on how often my agents actually hit
their context limit and compact — which I haven’t measured yet.
Choosing and tuning inference stacks for production agent workloads is a chunk of what I do as a fractional CTO. If you’re standing one up and want a second pair of eyes before committing to hardware, reach out.
Two things that didn’t move the needle
I updated intel-compute-runtime from 26.18 to 26.22 to see whether Intel’s recent
kernel work changed anything. It did not. The 32K row came back byte-identical to
the run before the upgrade — same prefill, same decode, same time. Not within
noise. Identical.
I also rebuilt both backends at current HEAD, seven weeks newer than the build in my last post. SYCL gained 23% on decode at 32K. Vulkan was unchanged — 600 t/s prefill before, 596 after. The recent upstream movement on this card has gone to the SYCL side.
One correction to my last post
The FAQ in my previous post tells you to check matrix cores: NV_coopmat2 in the
device line as confirmation you’re on the fast Vulkan path. Don’t rely on that.
My June build reports NV_coopmat2. A current build, same card, same driver, same
hour, reports KHR_coopmat — and turns in 78.7 t/s on the generation benchmark
against the June build’s 78.4. The label changed; the performance didn’t.
llama.cpp changed what it prints there somewhere in the last seven weeks.
If you followed that advice, saw KHR_coopmat, and went hunting for a driver
problem: there probably isn’t one. Compare throughput numbers instead.
How I measured it
The benchmark is a short bash script. It points at a running llama-server, walks a list of prompt depths, and at each one sends the same request twice — once forcing a full prefill, once letting the prefix cache hit. It reads the prefill and decode timings out of the API response rather than timing the whole request, so the two stay separate, and it takes the median of three runs per cell because single samples at these depths are noisier than you’d like.
One machine is not a dataset. If you’re running a B70 — or any Battlemage card,
or honestly any non-CUDA setup — get in
touch and I’ll send you the script. I’m
specifically curious whether the f16 result holds on the B60 and B580, and
whether anyone can explain what SYCL’s attention path is doing differently.
The reader who prompted all this also pointed me at an open llama.cpp issue documenting the same decay on a B70 running Windows 11 — different OS, different driver stack, a 53% generation decline from 4K to 32K against my 49%. It’s still unconfirmed upstream.
The thread does contain a plausible mechanism. llama.cpp’s Vulkan maintainer, 0cc4m, guesses that Intel’s cooperative-matrix support isn’t compatible with the flash-attention shader, which wants 16x16 coopmat — then adds the caveat that matters most here: he has “no Battlemage GPU to confirm it”. That is the whole problem with this card in one sentence. The people who could diagnose it don’t have one, and the people who have one mostly aren’t reading shader code.
The reporter’s own follow-up matches what I measured from the other direction: both backends decay, but “Just Vulkan’s is a bit more dramatic”.
The same thread also points forward, and it’s the reason I’d put a shelf life on everything above. In June another B70 owner reported “Crazy good Vulkan FA performance” from an in-flight PR adding Intel Xe-specific flash-attention kernels. It was still open when I published this, so none of my numbers reflect it — but if it lands and holds up, the Vulkan column changes and the recommendation below may not survive it. Nothing here is a claim about the hardware; it’s a claim about the builds you could download in July 2026. There’s also a B50 owner on the tracker reporting prompt processing collapsing to single digits during agent work, starting around 4-8K. Whether those are the same phenomenon at different scales, I don’t know.
What I haven’t answered
I don’t know why SYCL’s f16 path holds up and everything else doesn’t. I ruled
out the oneDNN flash-attention merge; beyond that I’m guessing.
I don’t know how often real agent sessions compact, which is the number that decides whether shorter slots are worth the speed.
I don’t have my own Windows numbers, though the issue above suggests the picture there isn’t better.
And I don’t know whether any of this generalizes past this specific card and this specific model. One machine is not a sample.
The full data
Putting this here for anyone who wants the receipts. Qwen3.6-35B-A3B Q4_K_M on a
single Intel Arc Pro B70, llama.cpp build 10107, --ubatch-size 2048, median of
three runs per cell.
Generation, single stream (t/s):
| Depth | Vulkan q4_0 | SYCL q4_0 | Vulkan f16 | SYCL f16 |
|---|---|---|---|---|
| 2,048 | 73.1 | 73.1 | 71.1 | 77.5 |
| 8,192 | 60.9 | 59.5 | 60.9 | 75.2 |
| 16,384 | 50.1 | 48.3 | 49.2 | 71.1 |
| 32,768 | 37.1 | 35.0 | 35.5 | 59.5 |
Cold prefill, single stream (t/s):
| Depth | Vulkan q4_0 | SYCL q4_0 | Vulkan f16 | SYCL f16 |
|---|---|---|---|---|
| 2,048 | 1,566 | 1,342 | 1,566 | 1,342 |
| 8,192 | 1,287 | 1,334 | 1,358 | 1,467 |
| 16,384 | 939 | 1,211 | 1,004 | 1,466 |
| 32,768 | 600 | 1,015 | 644 | 1,433 |
Four concurrent cold requests, aggregate (t/s):
| Depth | Vulkan q4_0 | SYCL q4_0 | SYCL f16 |
|---|---|---|---|
| 2,048 | 75.1 | 54.8 | 60.6 |
| 8,192 | 29.1 | 27.3 | 30.9 |
| 16,384 | 12.9 | 14.8 | 18.8 |
| 32,768 | 4.5 | 7.1 | 10.3 |
Wall time for one 32K request (seconds):
| Config | Cold | Warm |
|---|---|---|
| Vulkan q4_0 | 55.8 | 7.1 |
| SYCL q4_0 | 36.2 | 7.6 |
| SYCL f16 | 25.1 | 4.4 |
f16 runs used four slots at 48K each; q4_0 runs used four slots at 64K.
Single-stream figures were captured with one request in flight.
What I’d take from this
The lesson here isn’t f16. It’s that I benchmarked this card at a single prompt
depth, published the numbers, and recommended a configuration that quietly gives up
half its generation speed under the workload I actually run. Nothing I measured was
wrong. I just measured a point and reported it as though it were a curve — and the
one setting I never tested was the one that mattered.
That’s an easy mistake to keep making, because the benchmark everyone publishes is the benchmark everyone copies. If your agents run deep context, the number on the spec sheet and the number you’ll live with are different numbers.
Sizing an inference stack against the traffic you actually have — prompt depth, concurrency, how often an agent compacts — rather than against a headline figure is the kind of thing I work through with teams as a fractional CTO. Reach out if that’s where you’re sitting.
FAQ
Does the Intel Arc B70 slow down with longer context?
It depends on your KV
cache setting. With quantized cache — q4_0 or q8_0, what almost everyone runs
— generation drops from 73 t/s at 2K to 37 t/s at 32K, and cold prefill on Vulkan
falls from 1,566 t/s to 600. With f16 cache on the SYCL backend, generation only
drops from 77 to 60 and prefill stays flat at around 1,400 t/s.
What KV cache type should I use on the Intel Arc B70?
If you work past 16K of
context and can fit it, f16 on the SYCL backend — it’s 60% faster on generation
at 32K and more than twice as fast on prefill. If you need maximum per-slot
context on 32 GB, q4_0 is the only thing that fits 64K slots, at the cost of
roughly half your speed at depth. q8_0 is worse than both.
Is Vulkan or SYCL faster on the B70?
With quantized KV cache they’re
effectively tied on generation at every depth, and Vulkan scales better under
concurrency with short prompts. With f16 KV, SYCL is substantially faster at
depth and Vulkan is not — the f16 advantage is SYCL-specific.
Why does my coding agent feel fast after the first message? Prompt caching removes the prefill cost, and prefill is most of the wait on a deep cold request. At 32K a cold request takes about 56 seconds on a stock config and a warm one about 7. The generation rate is identical in both cases — you’ve stopped paying for prefill, not started generating faster.
Does the new SYCL flash-attention path fix context decay?
Not the decode half of it. A SYCL build from five weeks before that merge landed
already holds generation roughly flat at depth on f16 KV, so the decode behaviour
predates the patch. The merge is a prefill improvement: on the pre-merge build f16
prefill sags from 1,566 to 1,218 t/s by 32K, where the current build stays near
1,433.
Does updating intel-compute-runtime improve llama.cpp performance? It didn’t for me, going 26.18 to 26.22 — results were byte-identical at 32K. The gains on this card over the last two months came from llama.cpp itself.
How do I check whether my Vulkan build is on the fast path?
Not by the matrix cores: line. Recent llama.cpp builds report KHR_coopmat on hardware that
previously reported NV_coopmat2, with no performance difference. Compare your
actual throughput numbers against published figures for your card instead.